This post may contain affiliate links. Please see my advertiser disclosure for more details.
When Ken and I were looking for houses that might be good options for investment properties, we put together a detailed spreadsheet. The spreadsheet helped us compare the properties, weed out the duds (from a financial perspective), and narrow in on the properties that had higher returns on investment.
It’s worth noting that we had read quite a few books on the topic of rental properties and real estate investing at this point. (LikeThe Book on Rental Property Investing from Bigger Pockets and What Every Real Estate Investor Needs to Know About Cash Flow). So that helped us take into account all the different categories of potential expenses there are!

Immediate Cash Outlays
With regards to immediate cash outlay / expenses, we factored in:
- Down payment at 20% of the loan value (and we eventually changed that to 25% after learning that all the lenders we spoke with required 25% down payments for multi-unit investment properties)
- Closing costs and other closing expenditures at 5% of the loan value
- Immediate home repairs at 3% of the purchase price
Monthly / Regular Expense Estimating
For expenses that would be related to our monthly and annual cash flow, we factored in:
- Mortgage at an interest rate of 5% (at that point we hadn’t taken any mortgage pre-approval steps, so we weren’t sure what our interest rate would be).
- Property Taxes at 2% of the purchase price
- Insurance at 5.5% of the total monthly rent
- Vacancy at 5% of the total monthly rent
- Routine Home Repairs and Other Expenses at 5% of the total monthly rent
- Capital Expenditures (large home repairs, such as new roof, new driveway, etc.) at 13% of the monthly total rent
- Property Management fees (since we weren’t looking at any local properties, we’d require a property manager) at 11% of the total monthly rent.
Now, it’s worth reiterating that these percentages are just estimates. Granted, they are informed estimates based on figures from experienced investment property owners, but they’re still estimates nonetheless. Once we honed in on a few specific properties, then we requested much more specific expense information. For example, we requested local property tax receipts, called our insurance company for landlord policy estimates for that particular property, etc. But, for the purposes of just identifying good property prospects, those estimates were just fine.
Calculating Cash-on-Cash Return on Investment
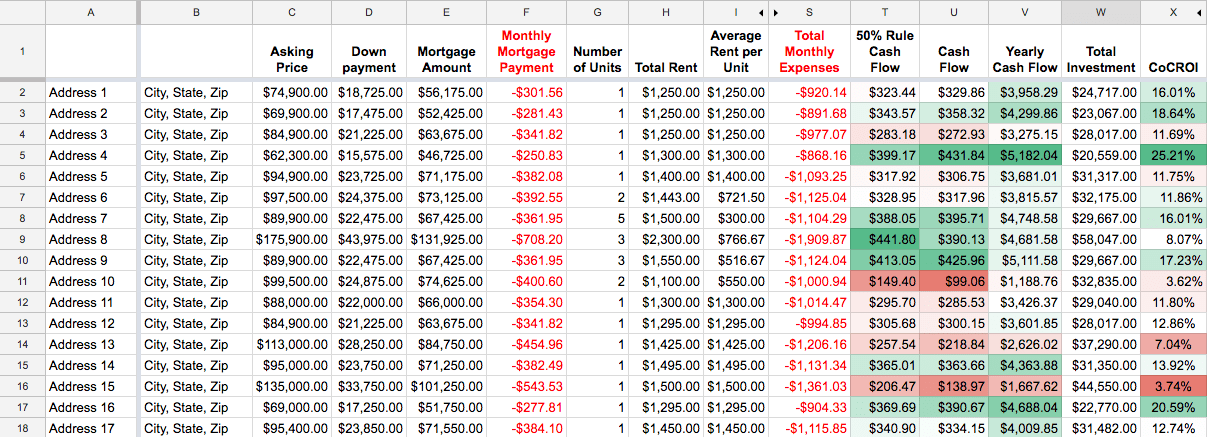
To identify the potentially “good” prospects, we used the calculation of Cash-on-Cash Return on Investment (CoCROI), as well as the “50% Cash Flow” Rule of thumb.
Here’s what our spreadsheet looked like after we had identified about 17 properties. (This is a collapsed view, “hiding” all the individual expense columns in Columns J-R, and just showing the total monthly expenses, including the mortgage payment in Column F, in one summed-up column. We also removed the specific location addresses in Columns A and B for posting on the blog.)
But, if you’re interested in seeing the spreadsheet with ALL the individual expenses in Columns J-R, here you go:
The main column we were focusing on was the last column, Column W – Cash on Cash ROI. We basically eliminated any house with less than a 10% cash-on-cash ROI. (If you’re interested in reading more about CoCROI, here are some definitions at Investopedia and at Bigger Pockets).
Prioritizing Houses with Higher CoCROI
Around Christmas time, we made some appointments with a realtor to see some of the properties with higher CoCROI figures (focusing on 10% and above). After seeing some of the properties in person, we narrowed down our list even more. We knew that, for our first investment property, we wanted to buy one that didn’t require that much up-front work. Although we’re seasoned home-improvers in our own home, we didn’t want to deal with that on our first investment property. Especially since we weren’t going to be local and couldn’t supervise any major home improvements. Perhaps that meant we wouldn’t get as good of a “deal” on a house that was being sold dirt cheap and needed a ton of work, but, that was fine for us, especially on our first investment property.
The house we decided to put an offer on was listed on the market for $89,900. It was a duplex, with one unit renting for $495, and the other for $595. There was also a detached garage rented separately for $225 / month. The seller had purchased the home about six years earlier for just $25,000, gutted it, and converted it to a duplex. He installed all new plumbing, all new electrical (including separate electrical panels for the units, including the garage), a new roof, and freshened everything up. The finishes are by no means high-end, but it certainly isn’t a high-end neighborhood either. It was also very close to my dad’s house, which was a big plus! That meant we could easily check on the property when visiting my dad.
The initial CoCROI for the home was 16.01% Not too shabby! That was taking into account a 25% downpayment. Each lender we spoke to said they required 25% downpayments for all multi-unit investment properties (unless we were planning on living in one of the units. Since we weren’t, that meant a 25% downpayment was unavoidable). Anyway, more on the mortgage process in a future post!
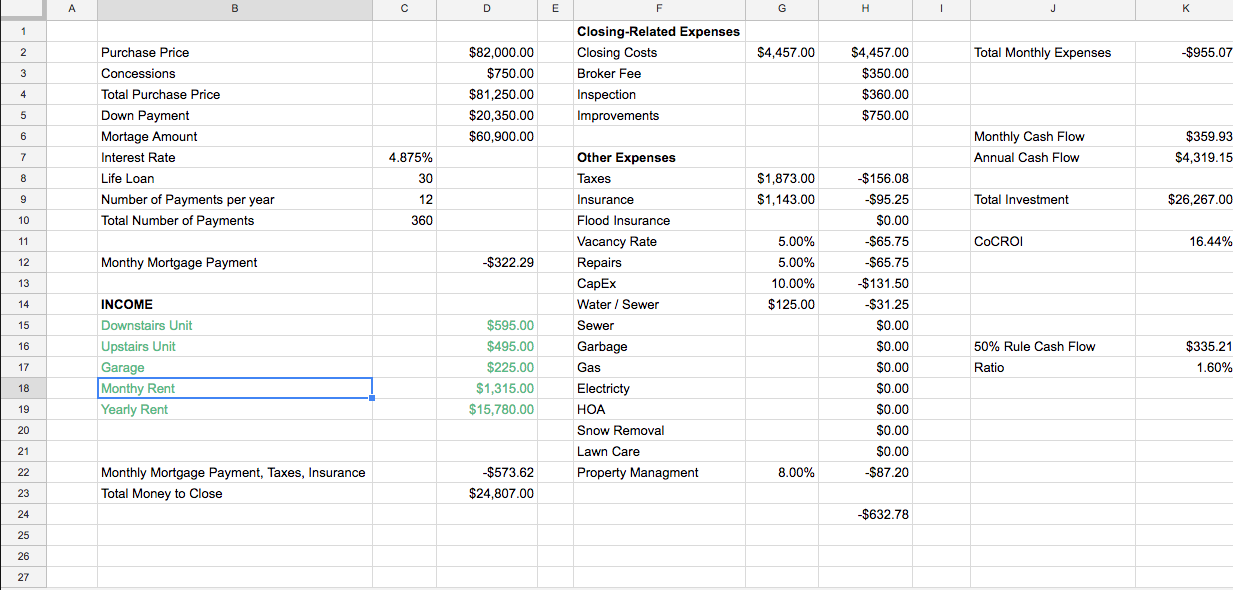
So, for the house we decided to put in an offer on, we took a few steps, many of which I outlined in this post. With some of the information that the seller provided, like the recent property tax bills, and the water, sewer, and refuse bills (which the owner, not the tenant, paid), we were able to firm up some of the expenses on our spreadsheet. We also got pre-qualified for a mortgage at 4.875%, so we factored that in as a more precise figure. The mortgage company also provided their estimates for closing costs, and other fees, like the inspection and appraisal. We also called our insurance company and gave them the home address and answered all their questions about the house, and they were able to give us an estimate on a landlord / homeowner’s insurance policy. That expense was actually much higher than we were anticipating, at nearly $1200 / year. We also added an umbrella policy for extra security.
We were able to lower our property-management expenses by negotiating their fee from 10% to 8% (and they also don’t take a percentage of the garage rent, we decided to manage that on our own since the garage tenant pays in advance for the year for the garage).
Every expense that we could more precisely estimate made us feel better about the entire process.
We ended up putting in a lower offer on the house, settling at $81,250. So that also helped with our initial cash outlays as well as our closing costs and monthly payments.
Here’s what our more precise spreadsheet looked like that was only specific to the house we were purchasing.
Ultimately, our CoCROI, taking into account all the “firm” expenses we had (but still estimating others) and the final offer price, was 16.44%. Not too bad! But, how will that ROI actually turn out after we have a year or two of reality under our belt? We’ll be sure to share that information!
P.S., if anyone is interested in the first “comparison” spreadsheet, here is a link to the document on Google Drive. To edit the document, click “File” and select either “Make a Copy” or “Download As.”


4 comments
Excellent. I have been looking for a spreadsheet to compare rental properties.
Where can I get the 2nd and 3rd tab calcuations?
Hmm, in the linked spreadsheet, there are only two tabs. And, they’re not calculations, they’re fixed percentage values based on estimates we learned about in real estate investing books.
Hi Melissa, thanks so much for sharing your knowledge with us.
I really like the way you organized the information.
Could we please access the spreadsheet that includes the precise calculations?
(The snapshot of the spreadsheet in your article containing actual prices) Thanks!
This is wonderful and exactly what I was going to create for myself. You are so great to she this! Thank you, ThankYOU! ????